 http://www.cbc.ca/arts/artdesign/story/2007/05/04/monroe-publicity.html
Nice figure you have there: UNIVARIATE
http://www.cbc.ca/arts/artdesign/story/2007/05/04/monroe-publicity.html
A handy guide for the graphical representation of data using the Student Version of SPSS (v. 16)
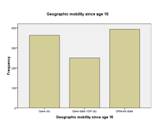
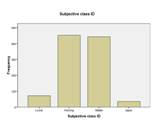
![]() To represent data measured at the nominal or ordinal level
To represent data measured at the nominal or ordinal level
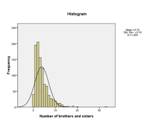
![]() To represent data measured at the interval level
To represent data measured at the interval level